Iran-Central Asia trade falling short of expectations
By Trend
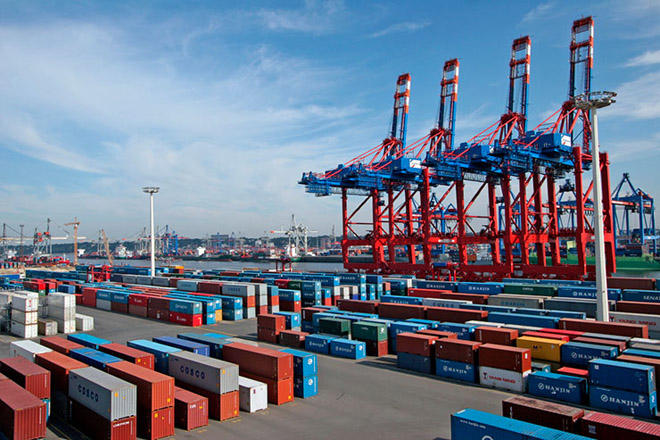
Iranian officials in last two years have tried to convince foreign investors to see the Islamic Republic not only as an 80-million market, but as a regional hub for access to an over 400-million market.
For Iranians, the Central Asian markets are one of the promising trade opportunities. The Islamic Republic since 1991 has attempted to develop relations with the Central Asian states, both bilaterally and through various regional foundations.
Following the removal of international sanctions against Tehran in 2016, the country sees huge opportunities in the region, in particular in delivering Central Asia’s natural resources to the world markets through establishing the long-awaited North-South transport corridor linking Kazakhstan, Uzbekistan and Turkmenistan to Persian Gulf.
The post-sanctions era also offers Iran new trade potentials with the region. However, some problems, with unsettled banking and money transfer problems on top of them, prevent Tehran from taking the opportunity.
Iran’s mutual trade with the Central Asian states has remained low in recent years.
In 2015, the Islamic Republic ranked seventh accounting for 1.9 percent of overall trade of the five Central Asian states, while Turkey, which despite lacking a direct access to the market, took a 5.6 percent share of the trade. Central Asia’s trade is dominated by China, Russia and the European Union.
Hereinafter, we will take a look at the Islamic Republic’s trade with the five Central Asian states, comparing the trade value before intensification of the sanctions in 2012, under the sanctions, and in post-sanctions era.
Turkmenistan
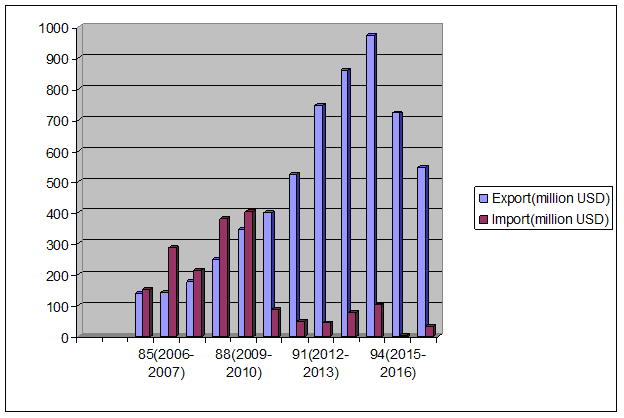
The figures show that Iran’s trade with Turkmenistan was not significantly affected by international sanctions against Tehran. The Islamic Republic’s exports to the neighboring country were on rise until 2015 and surpassed imports in 2010/2011 when Turkmenistan’s non-oil exports to Iran dramatically decreased by 79 percent to below $86 million.
Iran’s exports to Turkmenistan went downward in 2015/2016 and even decreased by 24 percent in the post-sanctions era.
Turkmenistan’s exports to Iran, on the other hand, experienced another significant fall by 945 percent in 2015/2016 to $6 million, but revived by 433 percent after removal of the international sanctions in 2016.
The following table, extracted from the data of Iran’s state-run Trade Promotion Organization (TPOI) and Tehran Chamber of Commerce shows Iran’s non-oil trade values with Turkmenistan in recent years.
|
Year (Iranian fiscal) |
Export, million USD |
Growth, % |
Import, million USD |
Growth, % |
Trade balance, million USD |
Trade volume, million USD |
|
84 (March 2005-2006) |
141 |
- |
153 |
- |
-12 |
294 |
|
85 (2006-2007) |
144 |
2 |
287 |
88 |
-143 |
431 |
|
86 (2007-2008) |
178 |
24 |
214 |
-25 |
-36 |
392 |
|
87 (2008-2009) |
249 |
40 |
380 |
78 |
-131 |
629 |
|
88 (2009-2010) |
346 |
39 |
403 |
6 |
-57 |
749 |
|
89 (2010-2011) |
400 |
16 |
86 |
-79 |
314 |
486 |
|
90 (2011-2012) |
526 |
32 |
48 |
-44 |
478 |
574 |
|
91 (2012-2013) |
749 |
42 |
44 |
-8 |
705 |
793 |
|
92 (2013-2014) |
859 |
15 |
77 |
75 |
782 |
936 |
|
93 (2014-2015) |
973 |
13 |
101 |
31 |
872 |
1074 |
|
94 (2015-2016) |
721 |
-26 |
6 |
-94 |
715 |
727 |
|
95 (2016-2017) |
546 |
-24 |
32 |
433 |
514 |
578 |
Kazakhstan
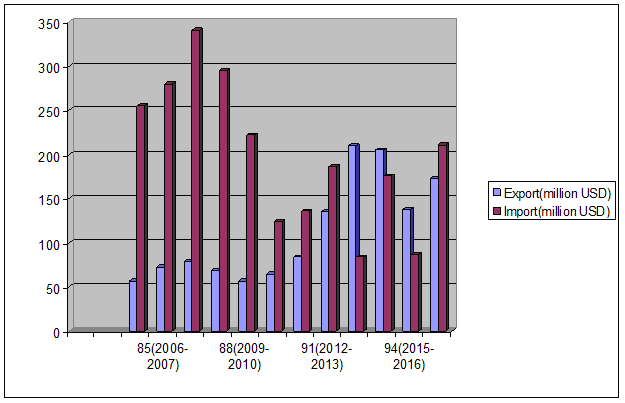
The data released by Iran’s governmental and non-governmental bodies indicate that the Islamic Republic’s trade with Kazakhstan experienced less impact from the global sanctions.
In last 10 years, Iran’s exports to Kazakhstan have gradually increased, while the imports’ value has fallen.
The two countries’ 2005/2006 trade balance of $198 million in favor of Kazakhstan became $126 million in favor of the Islamic Republic in 2013/2014. However, Kazakhstan’s exports to Iran surpassed again the imports in the first year of post-sanctions era and increased by 143 percent to $211 million.
The following table, extracted from the data of Iran’s state-run Trade Promotion Organization (TPOI) and Tehran Chamber of Commerce shows Iran’s non-oil trade values with Kazakhstan in recent years.
|
Year (Iranian fiscal) |
Export, million USD |
Growth, % |
Import, million USD |
Growth, % |
Trade balance, million USD |
Trade volume, million USD |
|
84 (March 2005-2006) |
57 |
- |
255 |
- |
-198 |
312 |
|
85 (2006-2007) |
73 |
28 |
280 |
10 |
-207 |
353 |
|
86 (2007-2008) |
79 |
8 |
341 |
22 |
-262 |
420 |
|
87 (2008-2009) |
69 |
-13 |
295 |
-13 |
-226 |
364 |
|
88 (2009-2010) |
57 |
-17 |
222 |
-25 |
-165 |
279 |
|
89 (2010-2011) |
65 |
14 |
124 |
-44 |
-59 |
189 |
|
90 (2011-2012) |
84 |
29 |
136 |
10 |
-52 |
220 |
|
91 (2012-2013) |
135 |
61 |
186 |
37 |
-51 |
321 |
|
92 (2013-2014) |
210 |
56 |
84 |
-55 |
126 |
294 |
|
93 (2014-2015) |
205 |
-2 |
176 |
110 |
29 |
381 |
|
94 (2015-2016) |
138 |
-33 |
87 |
-51 |
51 |
225 |
|
95 (2016-2017) |
173 |
25 |
211 |
143 |
-38 |
384 |
Kyrgyzstan
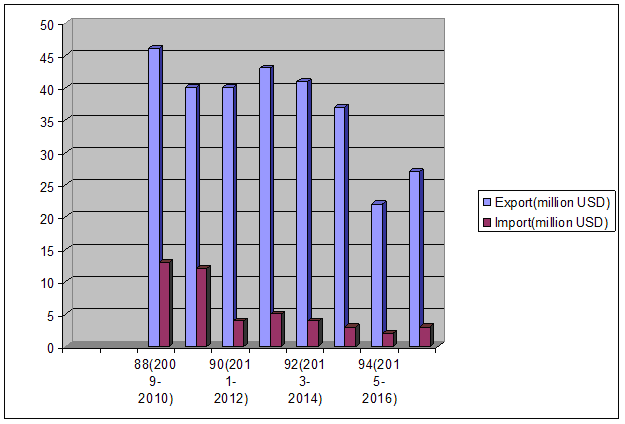
The available data indicates that the trade turnover between Iran and Kyrgyzstan was very low and also in decrease in last years from $59 million in 2009/2010 to $24 million in 2015/2016. The value revived by only $6 million after the removal of the international sanctions against Tehran in fiscal year which falls to 2016/2017.
The following table, extracted from the data of Iran’s state-run Trade Promotion Organization (TPOI) and Tehran Chamber of Commerce shows Iran’s non-oil trade values with Kyrgyzstan in recent years.
|
Year (Iranian fiscal) |
Export, million USD |
Growth, % |
Import, million USD |
Growth, % |
Trade balance, million USD |
Trade volume, million USD |
|
88 (2009-2010) |
46 |
- |
13 |
- |
33 |
59 |
|
89 (2010-2011) |
40 |
-13 |
12 |
-8 |
28 |
52 |
|
90 (2011-2012) |
40 |
0 |
4 |
-67 |
36 |
44 |
|
91 (2012-2013) |
43 |
8 |
5 |
25 |
38 |
48 |
|
92 (2013-2014) |
41 |
-5 |
4 |
-20 |
37 |
45 |
|
93 (2014-2015) |
37 |
-10 |
3 |
-25 |
34 |
40 |
|
94 (2015-2016) |
22 |
-41 |
2 |
-33 |
20 |
24 |
|
95 (2016-2017) |
27 |
23 |
3 |
50 |
24 |
30 |
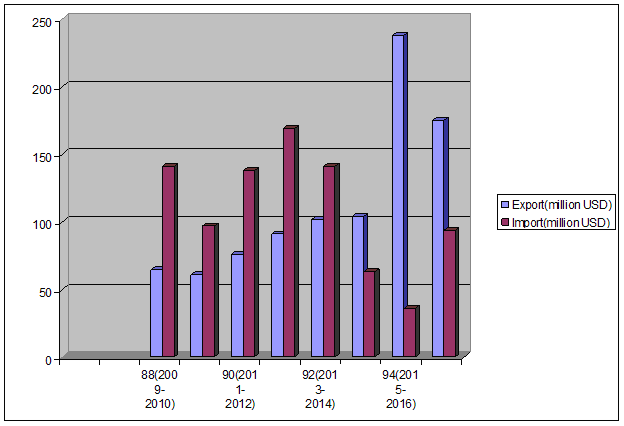
Uzbekistan
Iran’s exports to Uzbekistan have been on rise in recent years, while the Central Asian country’s exports to Iran have declined.
Trade balance changed in favor of Iran in 2014/2015 and trade turnover reached the highest value in recent years amounting to $274 million in the fiscal year to March 2016, the last year of the cracking sanctions against the Islamic Republic.
Immediately after removal of the sanction, Uzbekistan’s exports to Iran witnessed a rise by 161 percent in the fiscal year to March 2017, while Iran’s exports decreased to $175 million, registering a 26 percent fall.
The following table, extracted from the data of Iran’s state-run Trade Promotion Organization (TPOI) and Tehran Chamber of Commerce shows Iran’s non-oil trade values with Uzbekistan in recent years.
|
Year (Iranian fiscal) |
Export, million USD |
Growth, % |
Import, million USD |
Growth, % |
Trade balance, million USD |
Trade volume, million USD |
|
88 (2009-2010) |
65 |
- |
141 |
- |
-76 |
206 |
|
89 (2010-2011) |
61 |
-6 |
97 |
-31 |
-36 |
158 |
|
90 (2011-2012) |
76 |
25 |
138 |
42 |
-62 |
214 |
|
91 (2012-2013) |
91 |
20 |
169 |
22 |
-78 |
260 |
|
92 (2013-2014) |
102 |
12 |
141 |
-17 |
-39 |
243 |
|
93 (2014-2015) |
104 |
2 |
63 |
-55 |
41 |
167 |
|
94 (2015-2016) |
238 |
129 |
36 |
-43 |
202 |
274 |
|
95 (2016-2017) |
175 |
-26 |
94 |
161 |
81 |
269 |
Tajikistan
Iran-Tajikistan trade balance was in favor of Iran in recent years. The Central Asian country’s imports from Iran reached highest value when the sanctions against Tehran were intensified in 2012, then gradually decreased to $150 million in 2015/2016. However, it then revived by 33 percent to $199 million after the removal of the sanctions.
The following table, extracted from the data of Iran’s Customs Administration and Tehran Chamber of Commerce shows Iran’s non-oil trade values with Tajikistan in recent years.
|
Year (Iranian fiscal) |
Export(million USD) |
Growth% |
Import(million USD) |
Growth% |
Trade balance(million USD) |
Trade volume(million USD) |
|
85(2006-2007) |
127 |
- |
8 |
- |
119 |
135 |
|
86(2007-2008) |
170 |
34 |
24 |
200 |
146 |
194 |
|
87(2008-2009) |
187 |
10 |
39 |
63 |
148 |
226 |
|
88(2009-2010) |
163 |
-13 |
50 |
28 |
113 |
213 |
|
89(2010-2011) |
164 |
1 |
29 |
-42 |
135 |
193 |
|
90(2011-2012) |
195 |
19 |
17 |
-41 |
178 |
212 |
|
91(2012-2013) |
263 |
35 |
35 |
106 |
228 |
298 |
|
92(2013-2014) |
248 |
-6 |
19 |
-46 |
229 |
267 |
|
93(2014-2015) |
223 |
-10 |
19 |
0 |
204 |
242 |
|
94(2015-2016) |
150 |
-33 |
12 |
-37 |
138 |
162 |
|
95(2016-2017) |
199 |
33 |
16 |
33 |
183 |
215 |

Overall Iran-Central Asia Trade
The statistics of the Iran-Central Asia trade matches the remarks by Iranian officials about the little impact of the international sanctions on Iran’s trade ties with neighboring countries, compared to the ties with other countries.
The Islamic Republic’s Foreign Minister Mohammad Javad Zarif earlier told Trend that under the sanctions "Iran’s relations with neighbors were affected less than with others. However, with the onset of the nuclear talks, Iran’s neighbors also took a more active approach to Iran."
However, the Central Asian countries’ share in Iran’s foreign trade does not coincide with the potentials the parties enjoy.
Iran’s trade with the five countries during the last fiscal year (ended March 2017), when the sanctions were removed, was equal to 1.7 percent of the country’s overall non-oil trade ($87.614 billion).
|
Year (Iranian fiscal) |
Export, million USD |
Growth, % |
Import, million USD |
Growth, % |
Trade balance, million USD |
Trade volume, million USD |
|
88 (2009-2010) |
677 |
- |
829 |
- |
-152 |
1506 |
|
89 (2010-2011) |
730 |
8 |
348 |
-58 |
382 |
1078 |
|
90 (2011-2012) |
921 |
26 |
343 |
-1 |
578 |
1264 |
|
91 (2012-2013) |
1281 |
39 |
439 |
28 |
842 |
1720 |
|
92 (2013-2014) |
1460 |
14 |
325 |
-26 |
1135 |
1785 |
|
93 (2014-2015) |
1542 |
6 |
362 |
11 |
1180 |
1904 |
|
94 (2015-2016) |
1269 |
-18 |
143 |
-60 |
1126 |
1412 |
|
95 (2016-2017) |
1120 |
-12 |
356 |
149 |
764 |
1476 |
---
Follow us on Twitter @AzerNewsAz
Here we are to serve you with news right now. It does not cost much, but worth your attention.
Choose to support open, independent, quality journalism and subscribe on a monthly basis.
By subscribing to our online newspaper, you can have full digital access to all news, analysis, and much more.
You can also follow AzerNEWS on Twitter @AzerNewsAz or Facebook @AzerNewsNewspaper
Thank you!